1. Flowcharts
What it is: A visual representation of an algorithm or process showing the sequence of steps and decision points.
When to use: Representing algorithms, decision-making processes, program logic, troubleshooting procedures.
Example:
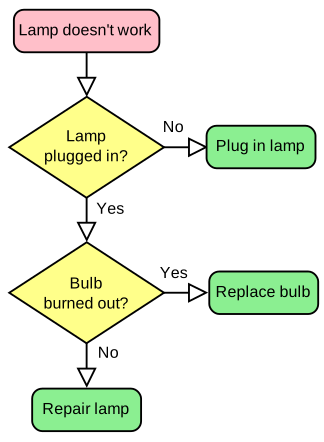
Notation Key
- Oval/Rounded Rectangle: Start and End points
- Rectangle: Process or action step
- Diamond: Decision point (Yes/No or True/False branches)
- Parallelogram: Input or Output operation
- Arrows: Flow direction showing sequence of steps
Common Mistakes
- Missing START or END ovals
- Decision diamonds without labeled branches (Yes/No)
- Arrows that don't clearly show flow direction
- Multiple processes combined in one box (keep one action per box)
- Flowlines that cross unnecessarily
Drawing Tips
- Flow should generally move from top to bottom or left to right
- Label ALL decision branches clearly
- Keep consistent spacing between symbols
- Use clear, concise text in each symbol
Scenario: Student Grade Classification System
Draw a flowchart for a system that:
- Receives a student's numeric mark (0-100) as input
- Determines the grade based on the following criteria:
- 85-100: High Distinction (HD)
- 75-84: Distinction (D)
- 65-74: Credit (C)
- 50-64: Pass (P)
- 0-49: Fail (F)
- Outputs the letter grade
- Ends the process
2. Context Diagrams
What it is: A high-level diagram showing a system and its interactions with external entities (users, other systems).
When to use: System planning phase, identifying stakeholders, defining system boundaries, initial requirements analysis.
Example:
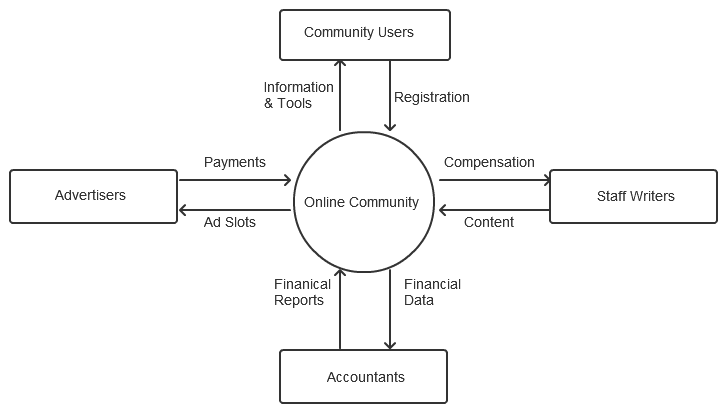
Notation Key
- Circle/Rounded Box (Center): The system being designed
- Rectangles: External entities (users, external systems, organizations)
- Labeled Arrows: Data flows between entities and system (must be specific, not generic "data")
- Arrow Direction: Shows whether data flows INTO or OUT OF the system
Common Mistakes
- Including internal processes (Context diagrams show external view only)
- Using generic labels like "data" or "information" (be specific: "payment details", "student records")
- Showing multiple systems in the center (Context = ONE system)
- Unlabeled arrows or missing arrow directions
- Confusing data flows with physical items
Drawing Tips
- Place the system in the center as a circle or rounded box
- Arrange external entities around the system in a balanced layout
- Use specific, descriptive labels for all data flows
- Show clearly which way data flows (arrows point in direction of flow)
- Keep the diagram simple - this is a high-level overview
Scenario: School Library Management System
Draw a context diagram for a library system with these external entities and interactions:
External Entities:
- Students: Submit borrow requests, receive due date notifications, return books
- Librarians: Process loans, receive overdue reports, update catalog
- Book Suppliers: Receive purchase orders, send book delivery confirmations
- School Database: Provides student enrollment data, receives borrowing history
System Name: Library Management System (place in center)
3. Entity-Relationship (ER) Diagrams
What it is: A diagram showing database structure including entities (tables), attributes (fields), and relationships between entities.
When to use: Database design, showing data relationships, identifying primary and foreign keys, normalizing data structures.
Example:
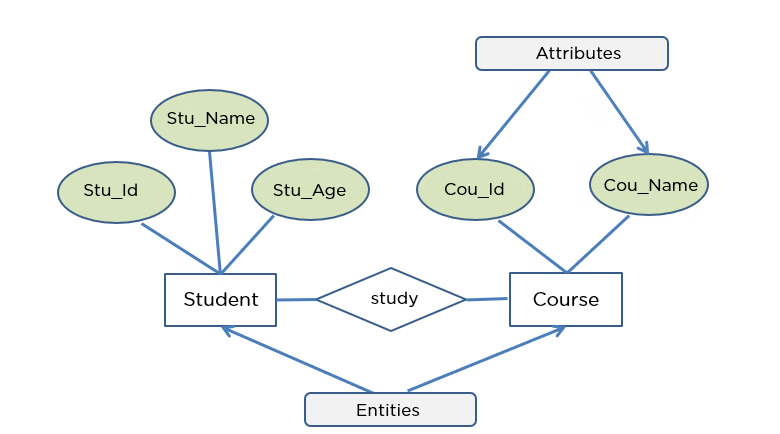
Notation Key
- Rectangle: Entity (represents a table in the database)
- Underlined Attribute: Primary Key (PK) - unique identifier for each record
- FK Label: Foreign Key - links to primary key in another table
- Lines with Labels: Relationships showing cardinality:
- 1:1 (One-to-One): One record relates to exactly one other record
- 1:M (One-to-Many): One record relates to many records
- M:N (Many-to-Many): Many records relate to many records (requires junction table)
Common Mistakes
- Not marking Primary Keys (underline or PK label is essential)
- Many-to-Many relationships without a junction table
- Missing Foreign Keys in related tables
- Not showing data types for attributes
- Placing attributes in relationships instead of entities
- Unclear or missing relationship cardinality labels
Drawing Tips
- Always underline or clearly mark Primary Keys
- Label Foreign Keys with "FK:" prefix
- For M:N relationships, create a junction table in the middle
- Include 3-5 key attributes per entity (don't list every field)
- Draw entities as rectangles divided into sections (name at top, attributes below)
- Show relationship lines clearly with cardinality labels
Scenario: Hospital Patient Management System
Draw an ER diagram with the following entities and relationships:
PATIENT
- PatientID (PK), Name, DateOfBirth, Address, Phone
- One patient can have many appointments
DOCTOR
- DoctorID (PK), Name, Specialization, Phone
- One doctor can have many appointments
APPOINTMENT
- AppointmentID (PK), DateTime, Duration, Notes, PatientID (FK), DoctorID (FK)
- Each appointment belongs to one patient and one doctor
- One appointment can result in many prescriptions
PRESCRIPTION
- PrescriptionID (PK), MedicationName, Dosage, Duration, AppointmentID (FK)
- Each prescription belongs to one appointment
4. Data Flow Diagrams (DFD)
What it is: Shows how data moves through a system's internal processes, including data stores and transformations.
When to use: System analysis, showing internal processing steps, identifying data transformations, documenting how data flows between processes.
Example:
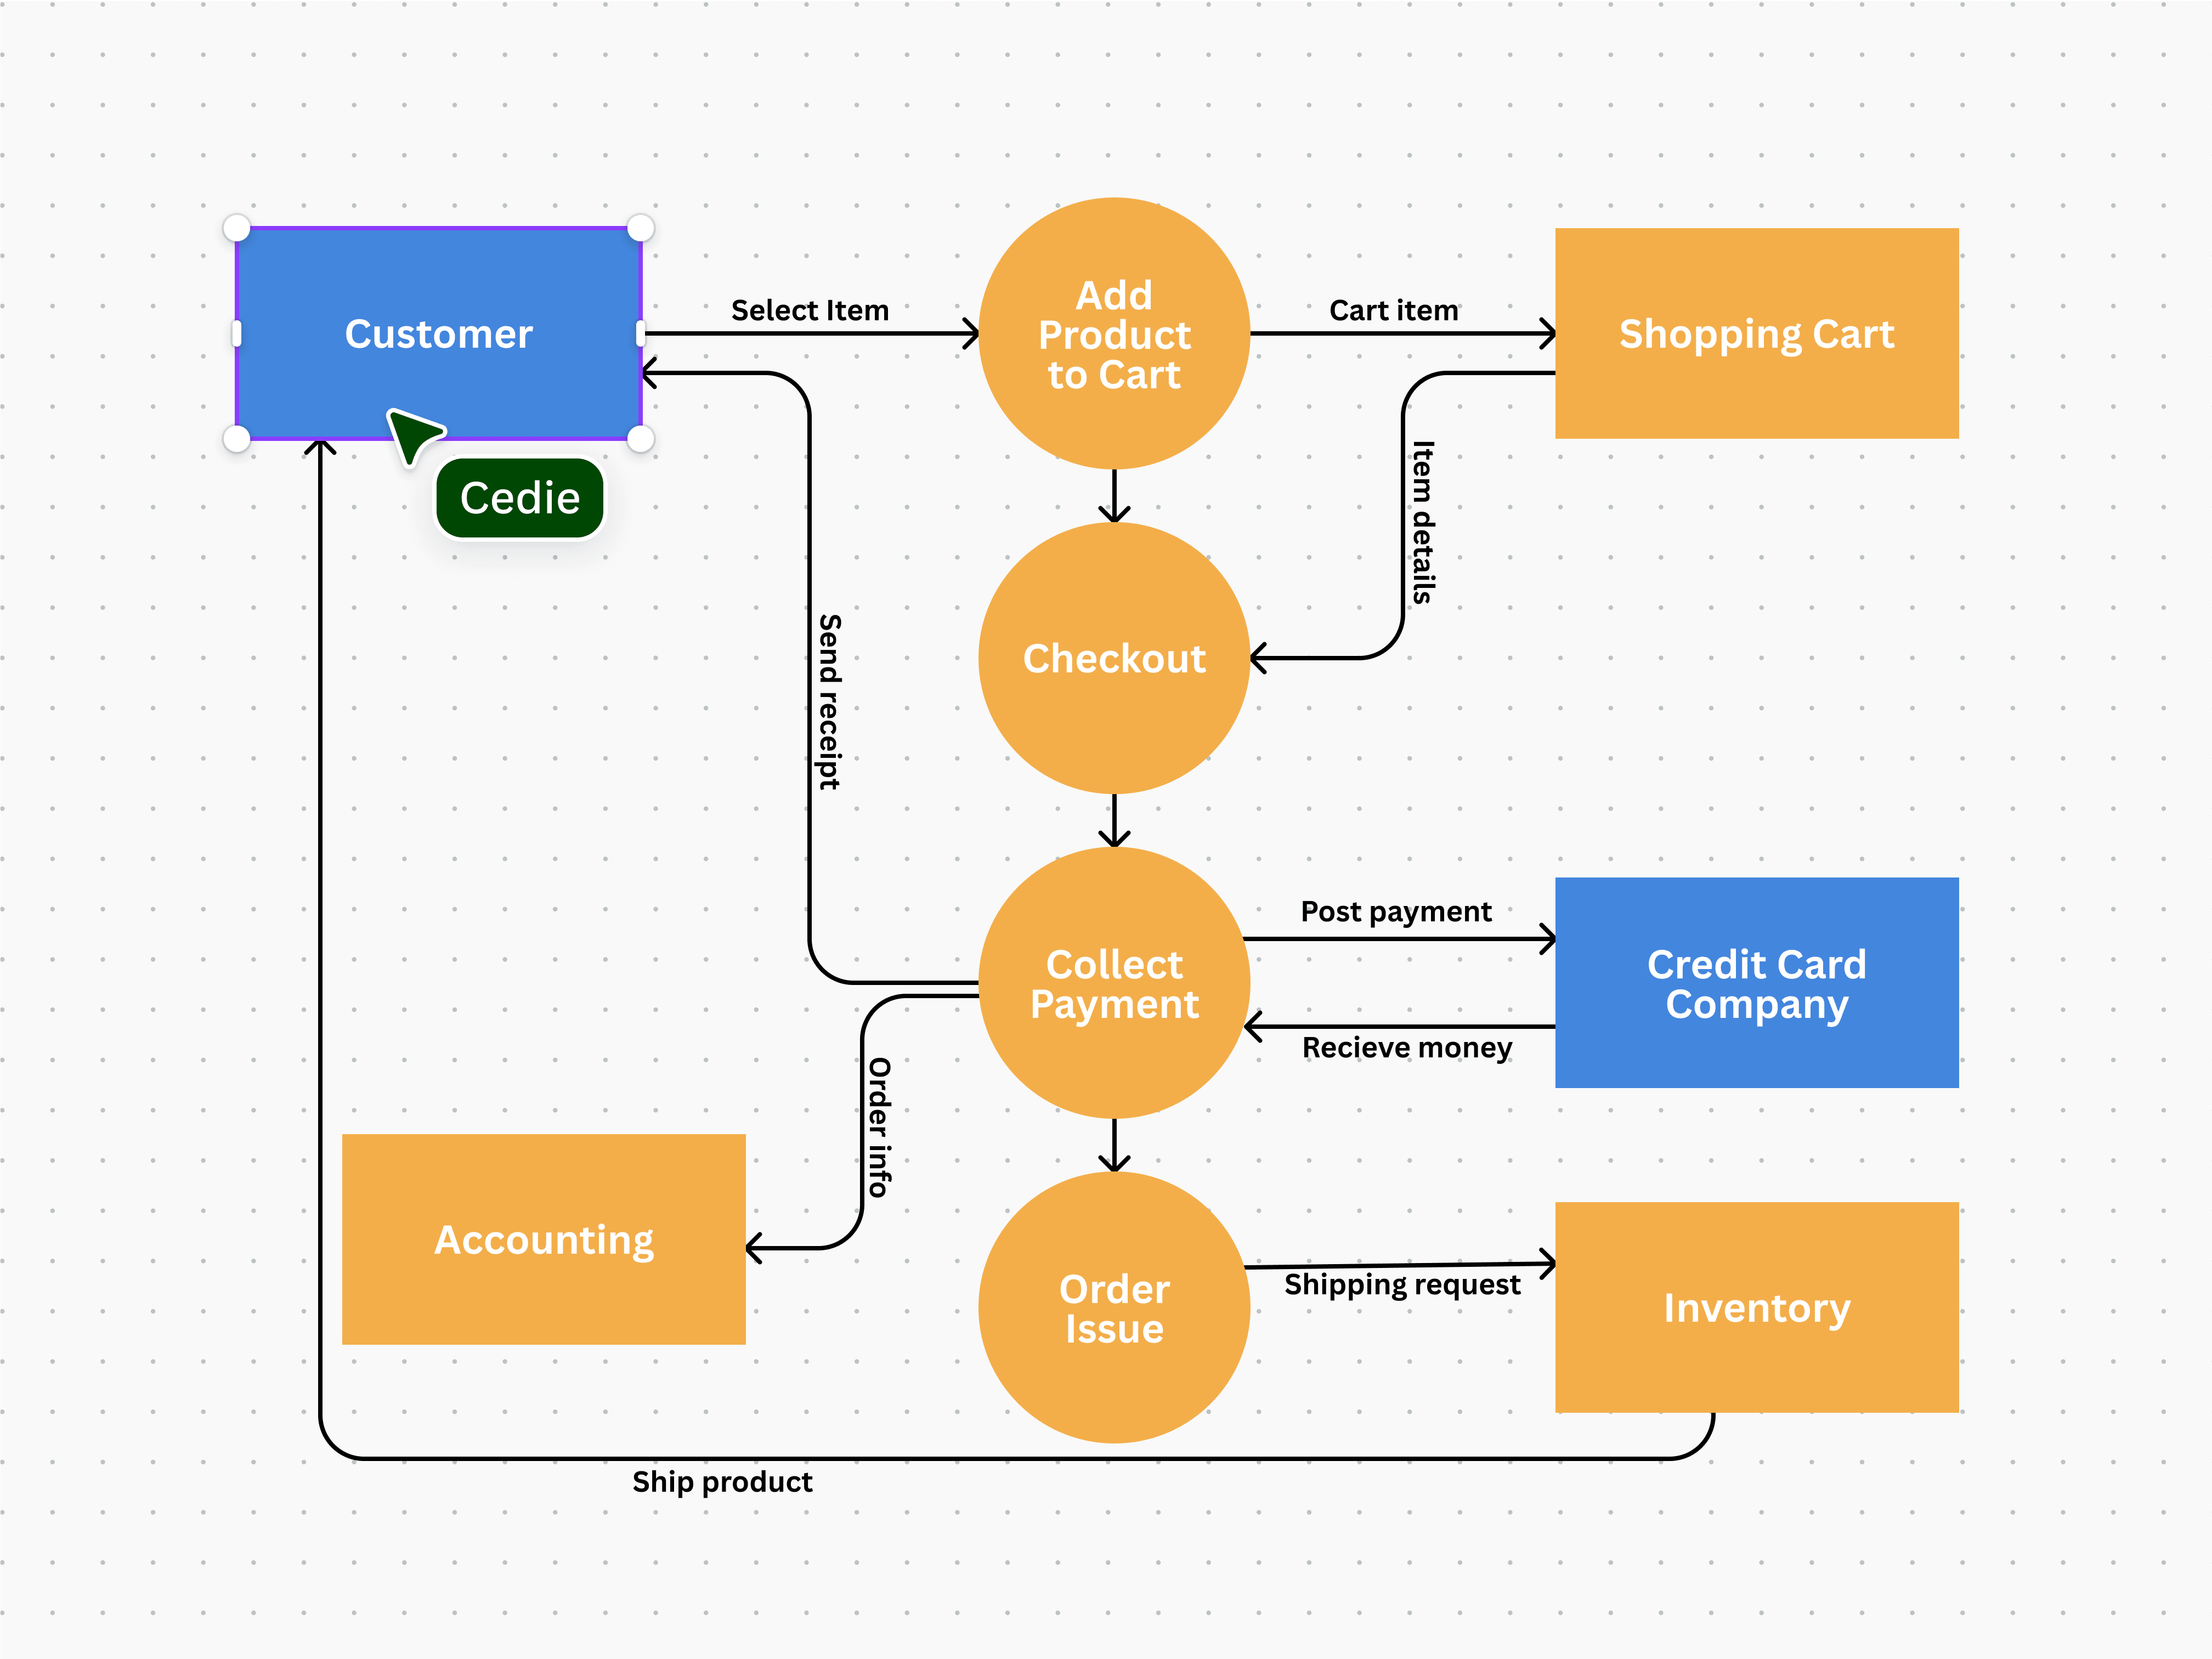
Notation Key
- Rectangle: External entity (same as Context Diagram - outside system boundary)
- Circle/Rounded Rectangle: Process (internal operations - MUST be numbered: 1.0, 2.0, 3.0...)
- Parallel Lines (Open Rectangle): Data store (database, file, memory - labeled D1, D2, D3...)
- Labeled Arrows: Data flows (must show specific data, not generic "data")
Common Mistakes
- Processes not numbered (numbering is required: 1.0, 2.0, etc.)
- Generic data flow labels like "data" (use specific names: "order details", "validated payment")
- Missing data stores (if data is saved/retrieved, show the data store)
- Arrows without labels
- Confusing external entities with processes
- Physical items instead of data flows (show "shipping request", not "product")
Drawing Tips
- Number all processes sequentially (1.0, 2.0, 3.0...)
- Use verb-noun format for process names ("Process Order", "Validate Payment")
- Label data stores with D1, D2, D3, etc.
- Ensure all data flows are labeled with specific data names
- Show logical flow from input through processing to output
- Keep layout neat - avoid crossing arrows where possible
Scenario: Online Food Ordering System
Draw a Level 0 DFD showing internal processes:
External Entity:
- Customer: Submits order, receives confirmation and delivery notification
- Restaurant: Receives order details, sends preparation confirmation
- Payment Gateway: Receives payment request, returns payment confirmation
Processes (number as 1.0, 2.0, etc.):
- 1.0 Validate Order (checks menu availability, calculates total)
- 2.0 Process Payment (sends to payment gateway, validates response)
- 3.0 Send to Restaurant (forwards order details)
- 4.0 Track Delivery (updates status, notifies customer)
Data Stores:
- D1: Menu Database
- D2: Orders Database
- D3: Customer Database
5. UML Class Diagrams
What it is: Shows object-oriented program structure including classes, attributes, methods, and relationships (inheritance, composition).
When to use: OOP design, showing class hierarchies, documenting inheritance relationships, planning code structure.
Example:
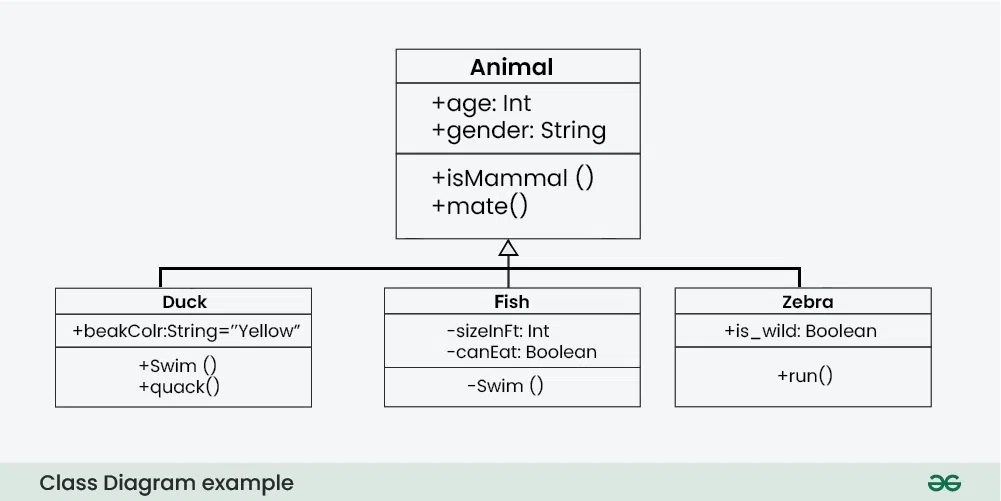
Notation Key
- 3-Part Rectangle: Class box divided into:
- Top: Class name (capitalized)
- Middle: Attributes with visibility and data type
- Bottom: Methods with visibility, parameters, and return type
- + (plus): Public visibility
- - (minus): Private visibility
- Hollow Arrow (▷ or →): Inheritance/"is-a" relationship (arrow points to parent class)
- Filled Diamond (◆→): Composition/"has-a" strong ownership
- Hollow Diamond (◇→): Aggregation/"has-a" weak ownership
- Simple Line/Arrow: Association/general relationship
Common Mistakes
- Inheritance arrow pointing wrong direction (must point FROM child TO parent)
- Missing visibility indicators (+/-) on attributes and methods
- Methods without return types or parameter types
- Attributes without data types (e.g., "age: int" not just "age")
- Confusing composition (filled diamond) with aggregation (hollow diamond)
- Class name not capitalized
Drawing Tips
- Parent/superclass should be drawn at the top, children below
- Always include visibility markers: + for public, - for private
- Format attributes as: visibility name: dataType (e.g., -age: int)
- Format methods as: visibility name(params): returnType (e.g., +getName(): String)
- Inheritance arrow must point from child to parent
- Diamond for composition goes on the "owner" side
Scenario: University Course Management System
Draw a class diagram with the following classes and relationships:
Person (parent/abstract class)
- Attributes: -personID: int, -name: String, -email: String
- Methods: +getName(): String, +getEmail(): String
Student (inherits from Person)
- Attributes: -studentNumber: String, -major: String, -gpa: float
- Methods: +enroll(course: Course): void, +getGPA(): float
Lecturer (inherits from Person)
- Attributes: -employeeID: String, -department: String, -salary: float
- Methods: +teach(course: Course): void, +getSalary(): float
Course
- Attributes: -courseCode: String, -courseName: String, -credits: int
- Methods: +getCourseInfo(): String, +addStudent(student: Student): void
Relationships:
- Student and Lecturer both inherit from Person (use hollow arrows)
- Student has association with Course (students can enroll in courses)
- Lecturer has association with Course (lecturers can teach courses)
Quick Reference Guide - All Diagrams
| Diagram Type |
Purpose |
Key Notation |
When to Use |
| Flowchart |
Show algorithm steps and decision logic |
• Oval: Start/End
• Rectangle: Process
• Diamond: Decision
• Parallelogram: I/O
|
Algorithm design, process flow, troubleshooting |
| Context Diagram |
Show system boundary and external interactions |
• Circle: System (center)
• Rectangle: External entity
• Labeled arrows: Data flows
|
System planning, requirements gathering, stakeholder identification |
| ER Diagram |
Show database structure and relationships |
• Rectangle: Entity/Table
• Underline: Primary Key
• FK: Foreign Key
• Lines: 1:1, 1:M, M:N
|
Database design, data modeling, normalization |
| Data Flow Diagram |
Show internal data processing and storage |
• Rectangle: External entity
• Circle: Process (numbered)
• Parallel lines: Data store
• Arrows: Data flows
|
System analysis, process documentation, data transformation |
| UML Class Diagram |
Show OOP structure and relationships |
• 3-part box: Class
• +/-: Public/Private
• ▷: Inheritance
• ◆: Composition
• ◇: Aggregation
|
OOP design, class hierarchy, code planning |
Common HSC Exam Question Types by Diagram
Flowcharts: "Draw a flowchart to show the algorithm for..." Common topics: validation, calculations, sorting
Context Diagrams: "Draw a context diagram for the described system showing all external entities and data flows"
ER Diagrams: "Design an ER diagram showing entities, attributes, primary/foreign keys, and relationships"
Data Flow Diagrams: "Draw a Level 0 DFD showing how data flows through the system's processes"
UML Class Diagrams: "Create a class diagram showing inheritance/composition relationships between the given classes"
Universal Drawing Tips for Exams
- Label EVERYTHING - unlabeled arrows or boxes lose marks
- Use standard notation - examiners expect conventional symbols
- Leave space between elements - avoid cluttered diagrams
- Draw in pencil first if possible - easier to correct mistakes
- Read the question carefully - include all required elements
- Time management: Don't spend more than 10-12 minutes on complex diagrams
- If unsure about notation, include a legend/key